Vent pressure

I thought that "vent pressure" was measuring the pressure inside my vents. It looks to me like it is actually just measuring ambient pressure in the room. It doesn't change at all as vents are open or closed, it just reports the same pressure metrics as my Airthings pressure readings.


-

To be mor rigorous, would you be able to pull in the data points into excel and graph them all on the same axis?
Also, you would need to make sure that you calibrate them such that when your furnace is off, they are at the same pressure.
Curious as to what this graph would look like. -

Thanks for the info. When I click "Edit Chart" it takes me to a website called "Plotly" where it shows the graph and spreadsheet style information. I was able to copy the rows and columns and paste them into excel. I will have to experiment with this more, but looks like I found a way to look at the raw data. Thanks again for the help.

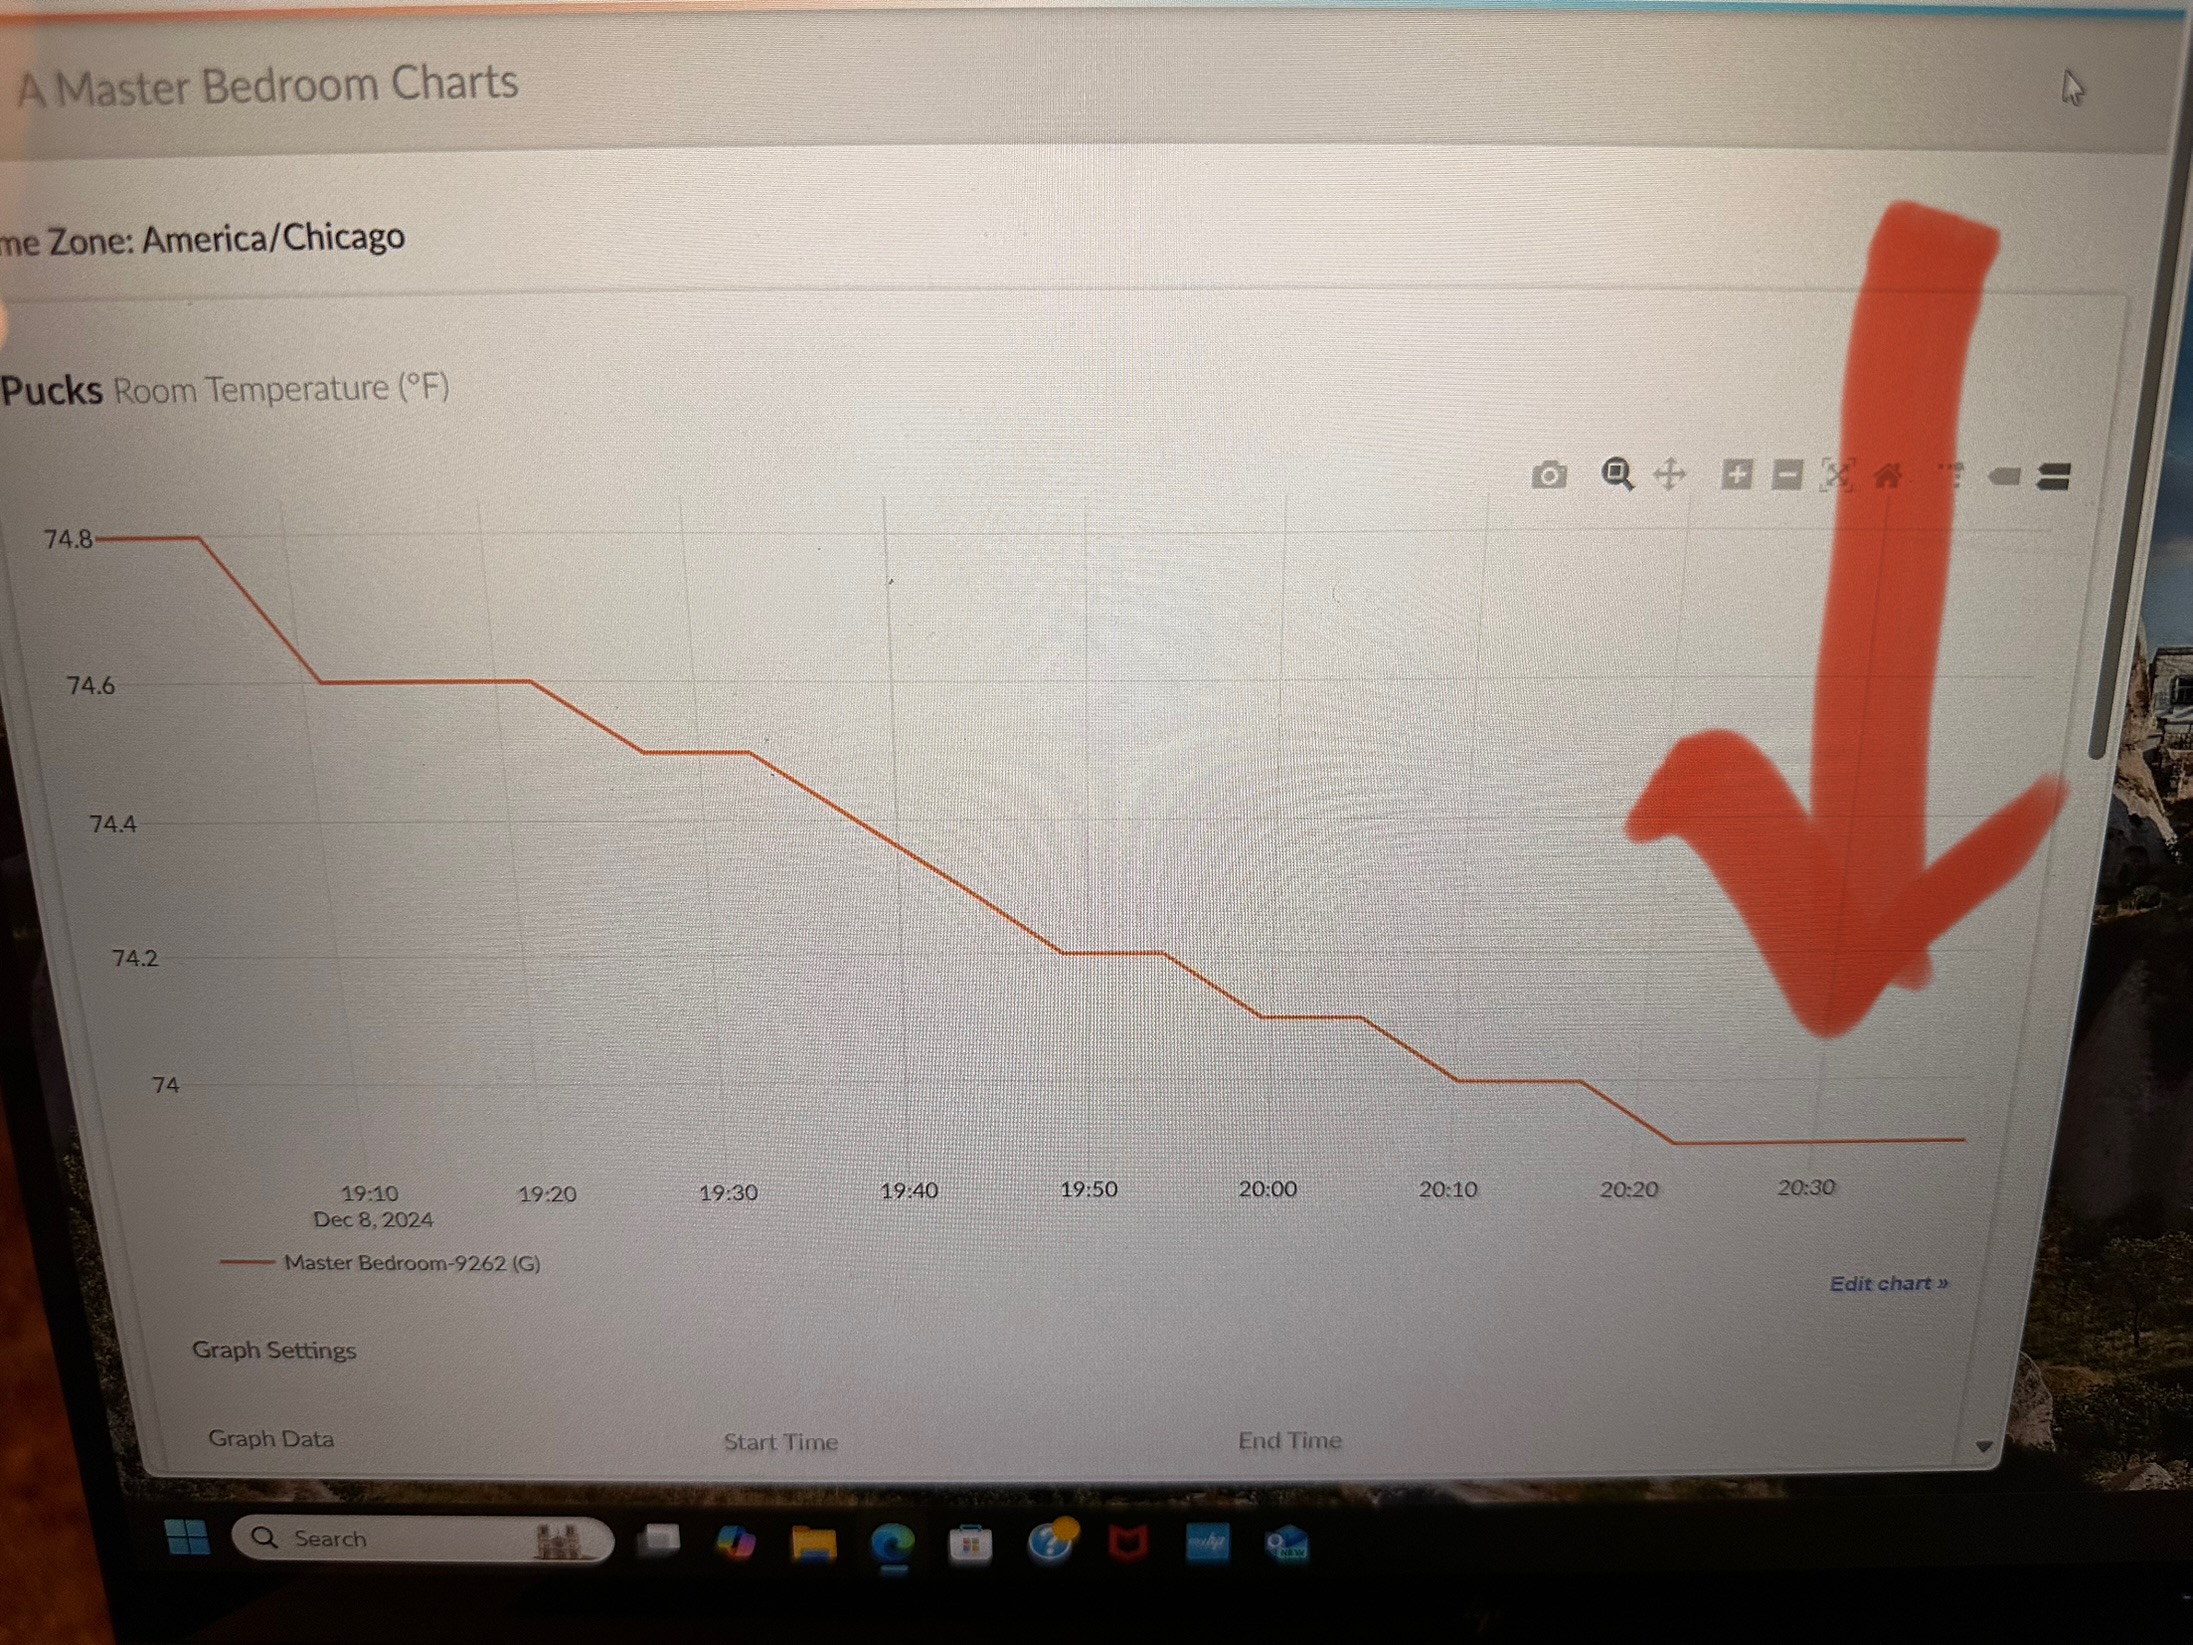 If you log into the my.flair.co and get into the stats graphs, the web version has an option somewhere that says edit graph or something like that. It shows the raw data. I just copied and pasted from that edit graph area.
Please sign in to leave a comment.
Comments
7 comments